Menu
Menu
Close
Close
Menu
Menu
Close
Close
A class assignment for MEJO487: Intermediate Interactive Media at UNC. I used open source data and D3.js to create reponsive data visualizations.
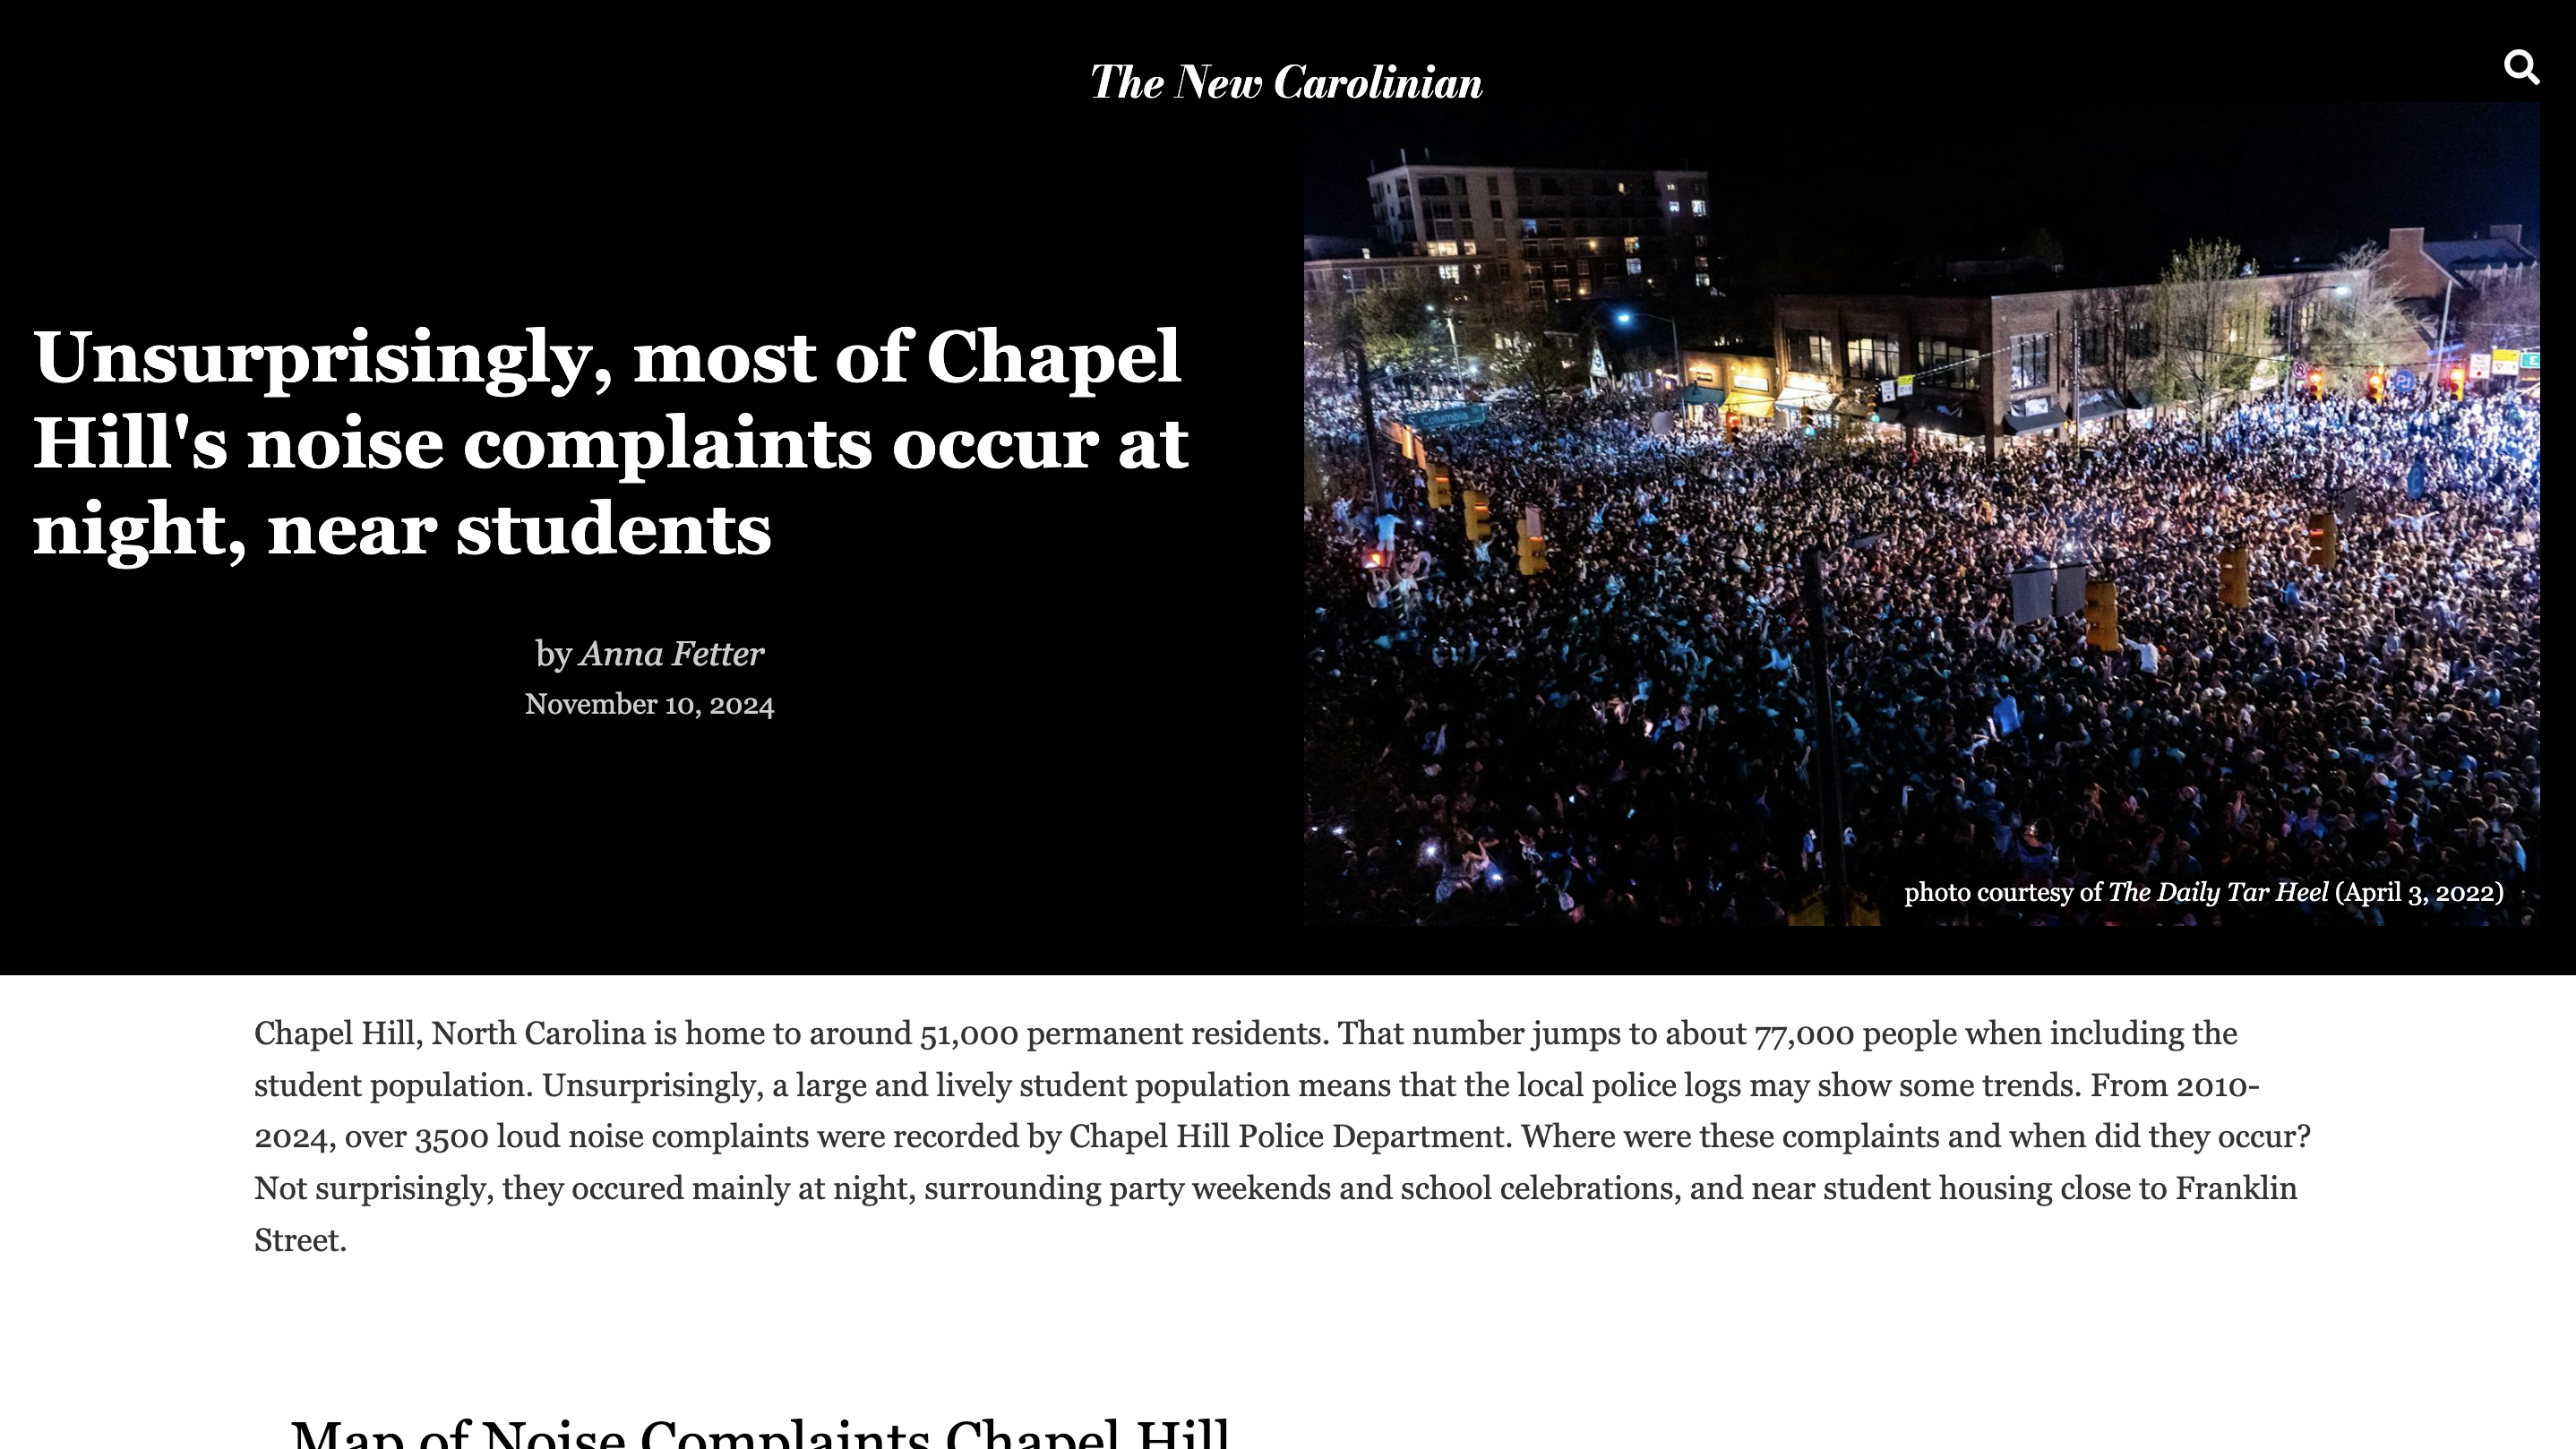
“Where
were
these
(noise)
complaints
and
when
did
they
occur?
Not
surprisingly,
they
occured
mainly
at
night,
surrounding
party
weekends
and
school
celebrations,
and
near
student
housing
close
to
Franklin
Street.”
Here's my responsive data dashboard made for MEJO487: Intermediate Interactive Media at UNC. I used publically available Chapel Hill police logs and sorted for open container and loud noise complaints in Chapel Hill. I used D3 to make responsive and interactive charts to visualize where and when these complaints were occuring. Here were the assignment requirements: - Responsive Design (Bootstrap) - Styles must mimic/copy a major publisher like NYTimes, WashPost, Vox, ESPN, etc. - Use of Charts and Graphs (Suggest Chart JS, C3.js, or HighCharts highcharts.com/)) - Featured Tabular Display of a subset of data (Top 10, Specific tag, or date) - Tabular Display of ALL data (suggest AG Grid or datatables.net )) - Use of strong UI elements, (tabs, accordion, sliders, overlays, etc.) - Use of any data from data.gov or other publically available source
